TL;DR
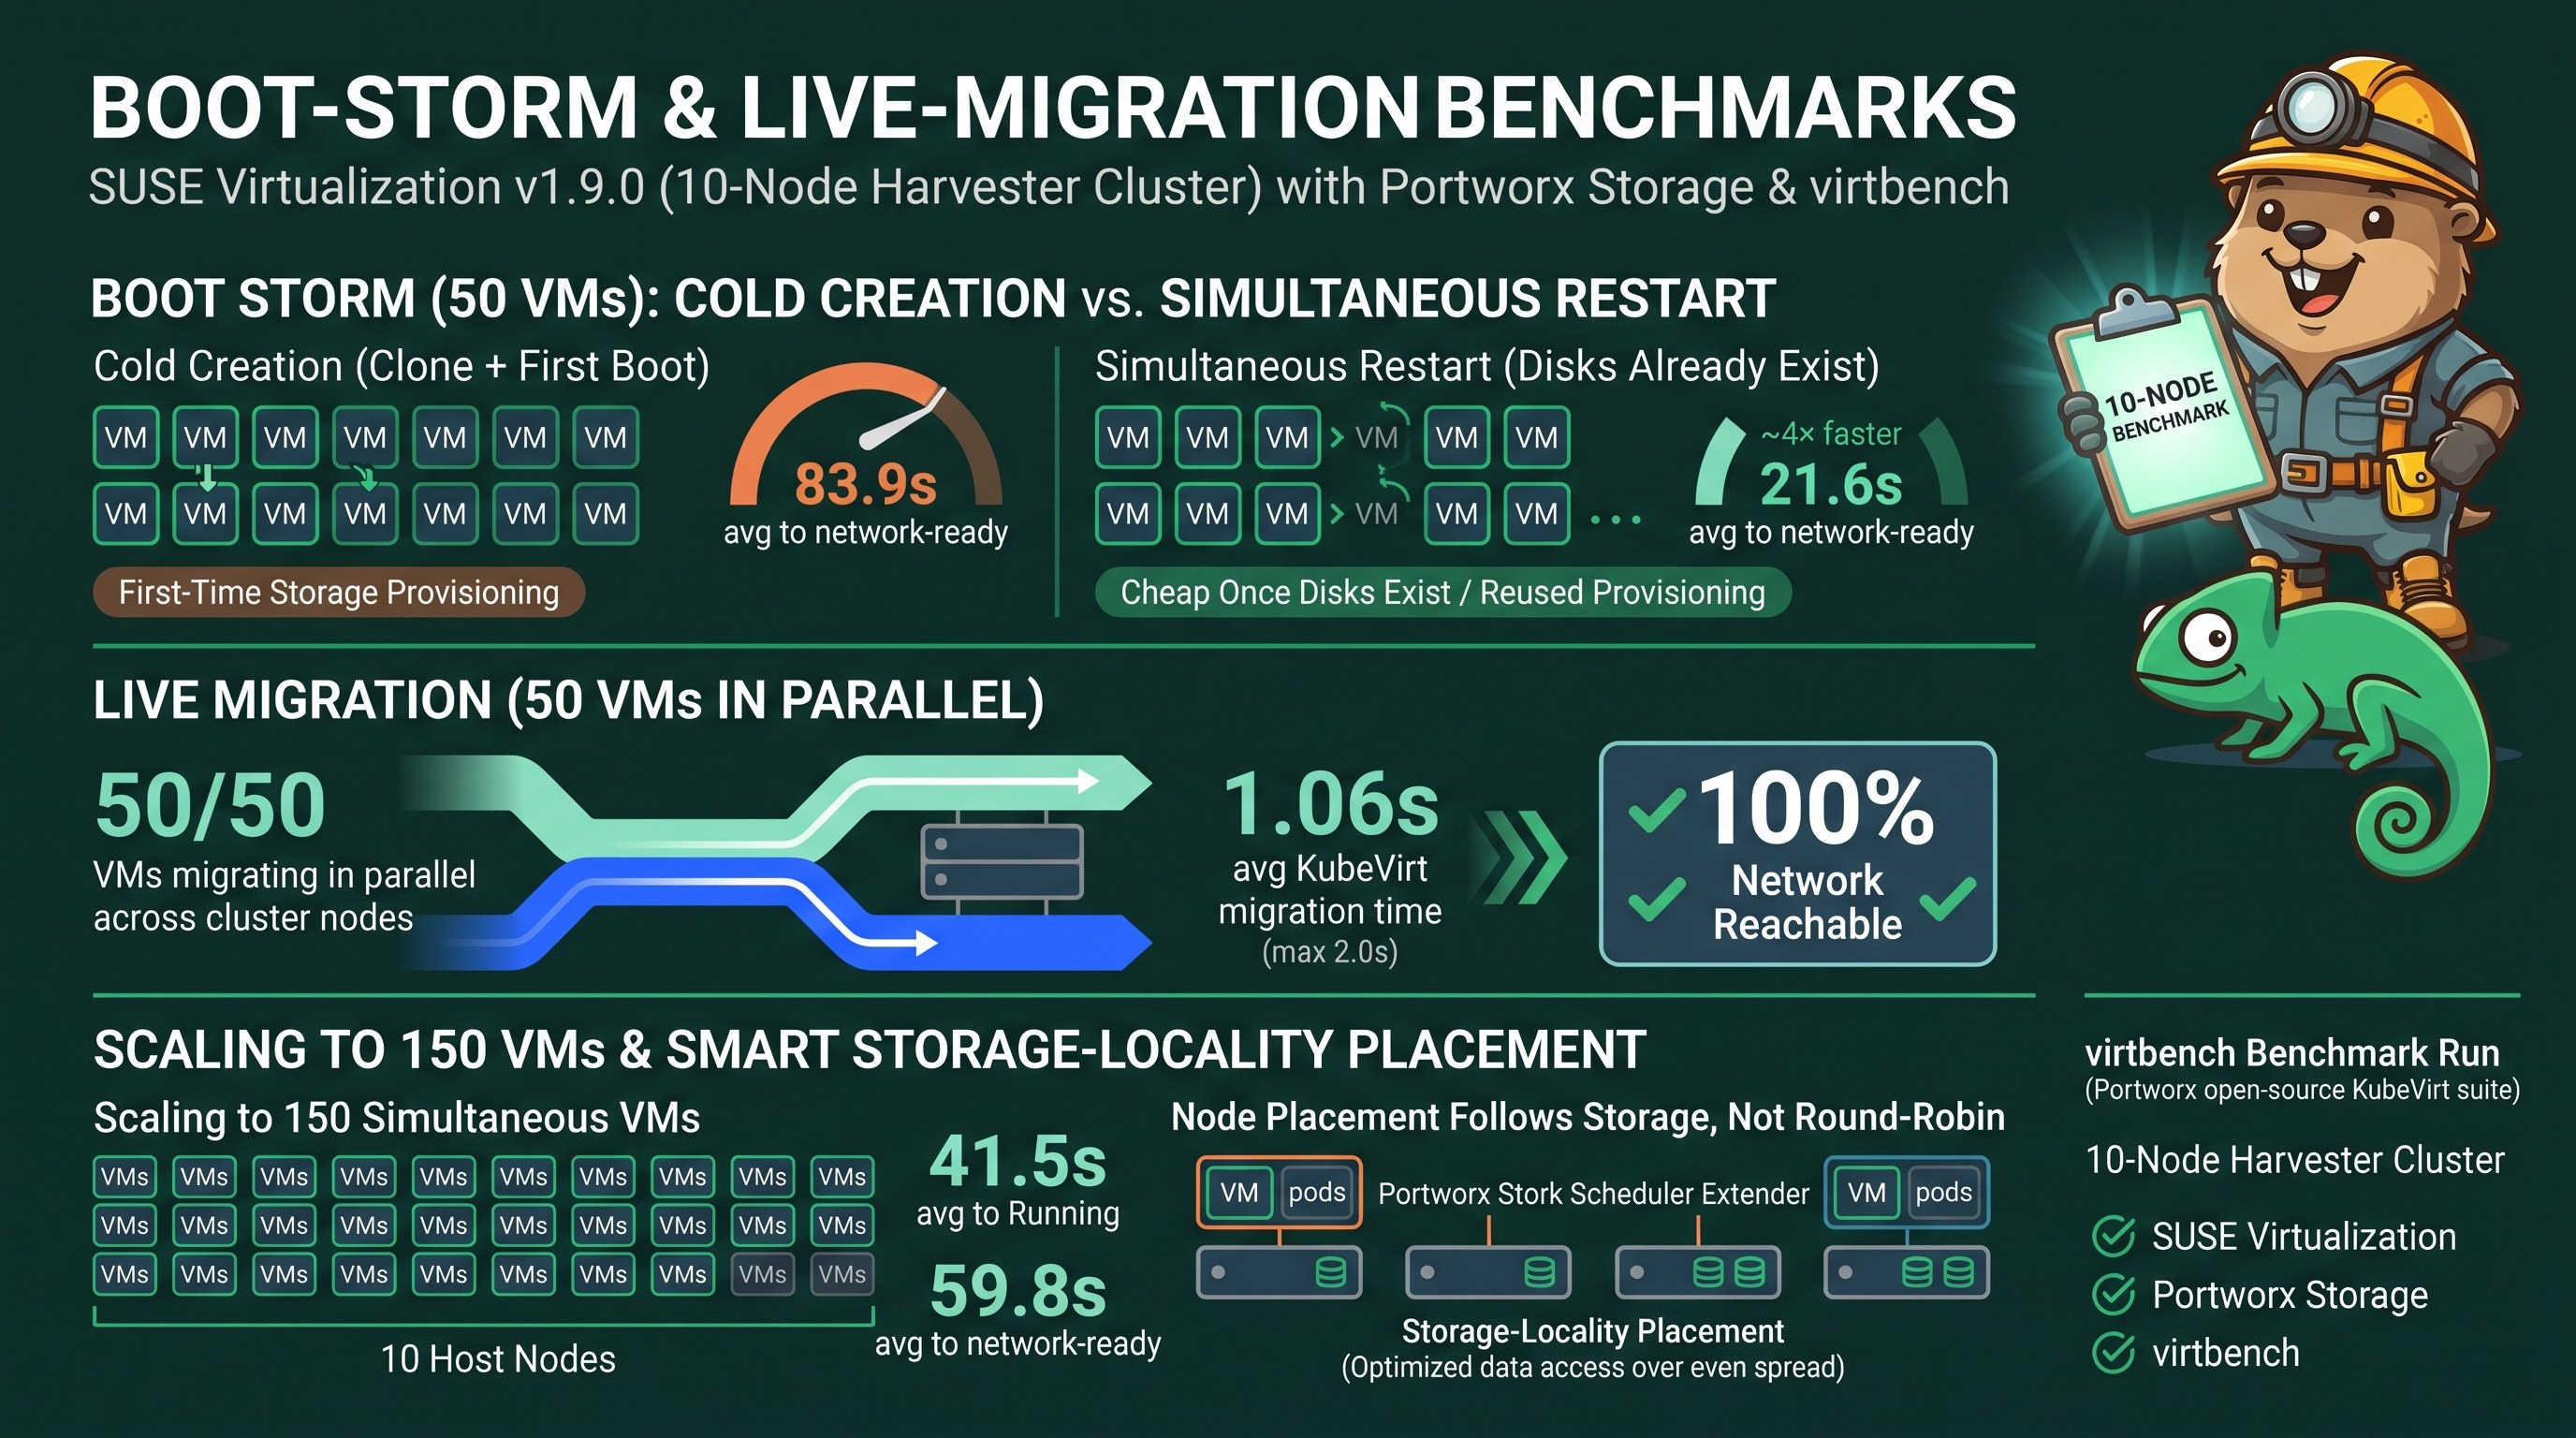
- virtbench, Portworx’s open-source KubeVirt benchmark suite, ran against a 10-node SUSE Virtualization (Harvester) cluster with Portworx-backed VM storage.
- Boot storm is cheap once disks exist. Restarting 50 running VMs simultaneously averaged 21.6 s to network-ready — close to 4× faster than the 83.9 s average for first-time creation (clone + first boot) at the same concurrency, because the storm reuses already-provisioned disks.
- Live migration is fast. 50/50 VMs migrated in parallel, averaging 1.06 s of actual KubeVirt migration time (max 2.0 s); every VM stayed network-reachable afterward.
- Scaled to 150 simultaneous VMs running cleanly across the 10 nodes, with VM creation at that density averaging 41.5 s to Running and 59.8 s to network-ready.
- VM placement under Portworx isn’t uniform across nodes: Stork, Portworx’s scheduler extender, places VM pods near their volume’s existing data replicas rather than spreading evenly — a storage-locality behavior worth knowing before reading node-level density numbers.
Test environment
Cluster: 10 SUSE Virtualization (Harvester v1.9.0) nodes on Vultr bare metal, each an AMD EPYC 4345P (8 cores / 64 GB RAM / 2× ~1.9 TB NVMe), running RKE2 v1.36.3 — 3 control-plane+etcd nodes and 7 workers. One NVMe disk per node runs the OS plus a Longhorn pool; the second is dedicated to Portworx Enterprise 3.7.1 (StoreV1). px-csi-replicated is the storage class under test, and VMs use the default pod network with masquerade binding.
Orchestration: virtbench itself ran from a separate 4-vCPU / 8 GB control host with network access to the cluster’s API — sized so the benchmark’s own client-side work (driving up to 150 VMs through the Kubernetes API, running readiness checks) never competes for the same CPU/storage the cluster under test is being measured on. All numbers below come from the cluster, not the control host.
Tool: virtbench 2.0.0, storage-vendor-neutral — it validates against any cluster running the standard virt-api/virt-controller/virt-handler KubeVirt pods, SUSE Virtualization included.
Boot storm: cold creation vs. simultaneous restart
virtbench’s datasource-clone --boot-storm flag runs a four-phase test: create every VM and measure, stop every VM, start every VM simultaneously and measure again. Each VM here is a 1 vCPU / 1 GiB openSUSE Leap 16 minimal image, cloned from a shared golden volume on px-csi-replicated.
| Phase | VMs | Success | Avg time to Running | Avg time to ping |
|---|---|---|---|---|
| Initial creation (clone + first boot) | 50 | 50/50 | 61.3 s | 83.9 s |
| Boot storm (simultaneous restart) | 50 | 50/50 | 14.5 s | 21.6 s |
Restarting is faster because the storm phase reuses disks that are already cloned — it isolates “cold clone + first boot” cost from pure “restart” cost, which is otherwise easy to conflate if only one phase gets measured. Both phases finished at 100% success with no VMs lost.
Live migration
Using the same 50 running VMs, virtbench migration --parallel --concurrency 10:
Total VMs: 50 | Successful: 50 | Failed: 0

  VMIM Time (Official KubeVirt Timestamps):
    Average: 1.06s   Minimum: 1.00s   Maximum: 2.00s
That’s the KubeVirt-reported VirtualMachineInstanceMigration duration — the time the platform itself spent migrating each VM, independent of how virtbench polls for completion. All 50 VMs answered network pings again immediately after.
Scaling to 150 VMs
Creating and running 150 VMs simultaneously across the 10-node cluster — one and a half times the first test’s density — stayed at 0 failures. Creation at that higher concurrency showed real, expected contention: a 69-VM batch averaged 41.5 s to Running and 59.8 s to ping, with a worst case of 96 s, versus 61.3 s / 83.9 s average at 50 VMs. That’s the shape of a genuine load curve: more simultaneous API server, scheduler, and CSI-attach work, not a cliff.
Node placement follows storage, not round-robin
Two of the ten nodes consistently ended up hosting more VMs than the rest. Portworx’s own scheduler extender, Stork, explains it: VM pods on this cluster run with schedulerName: stork, which places pods near their volume’s existing data replicas to cut storage I/O hops rather than spreading them evenly across nodes. That’s hyperconverged placement working as intended — worth knowing if you’re reading per-node VM counts and expecting an even split, since Portworx-backed density will cluster around whichever nodes hold the relevant replica data.
Takeaways
- Boot-storm and cold-creation numbers answer different questions — measure both, since a storm test alone understates first-boot cost and a creation test alone overstates restart cost.
- Live migration completed in close to real time (1-2 seconds of actual KubeVirt migration work) at 50-VM scale on Portworx-backed storage.
- 150 VMs ran simultaneously on 10 nodes with zero failures; density past that point is the next thing to map out.
- A Portworx-backed cluster’s VM-to-node distribution reflects Stork’s data-locality placement, not plain scheduler spreading — read node-level density numbers with that in mind.
What’s next
Pushing further past 150 VMs to find the cluster’s real capacity ceiling, and running virtbench’s chaos and I/O benchmark modes against the same Portworx storage class.