TL;DR
- High Performance adds one thing to Default, and it pays off. On block volumes,
Default already uses
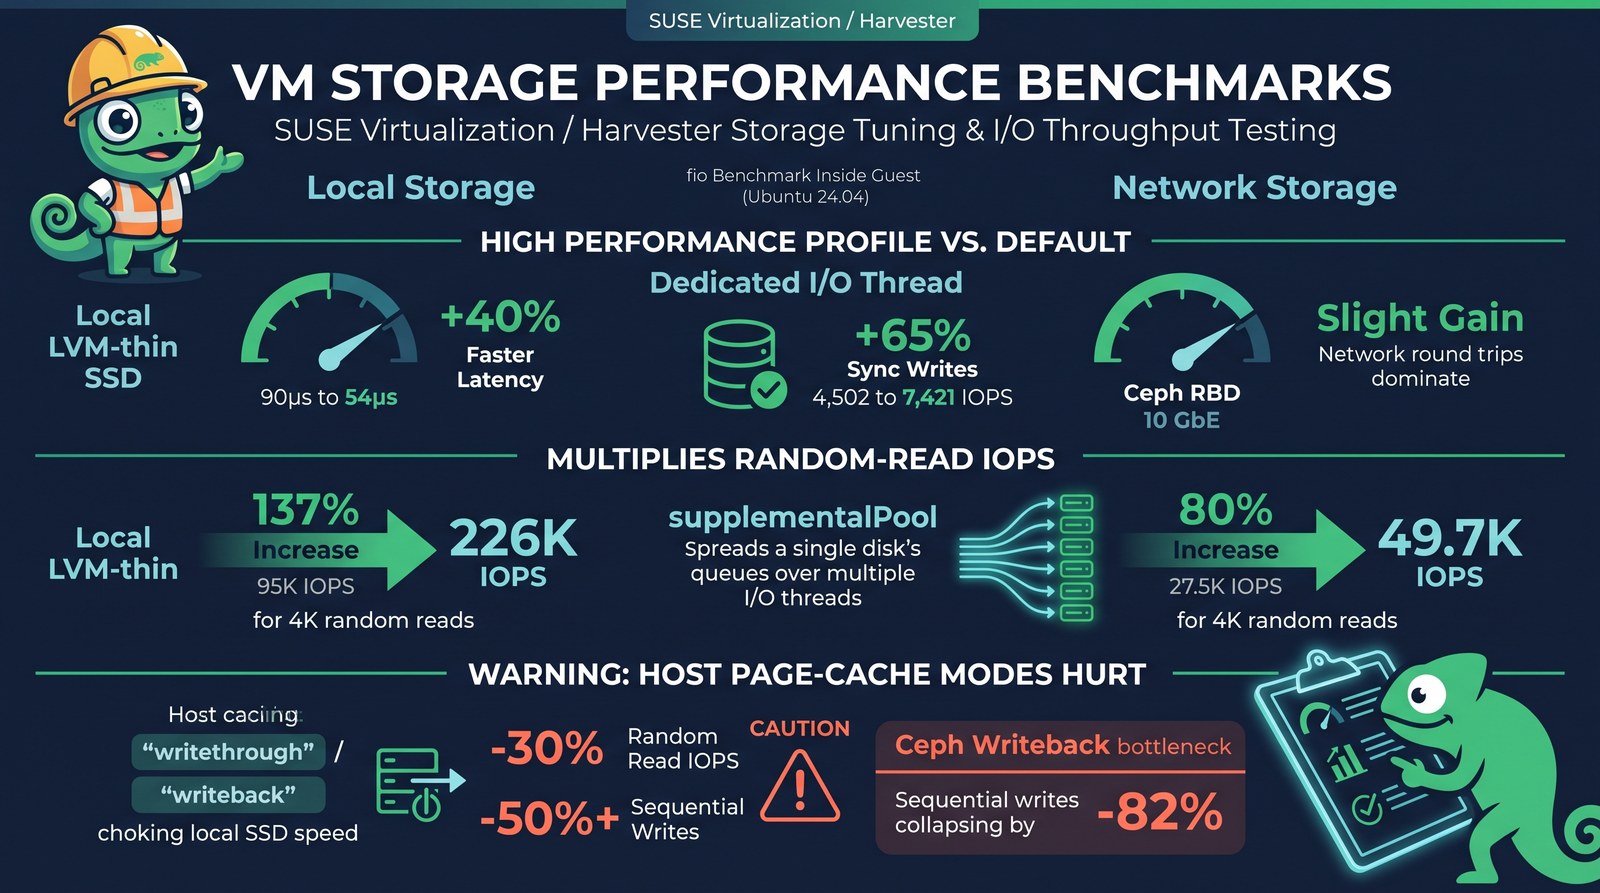
cache: noneandio: native, so the profile’s difference is a dedicated I/O thread for the disk. On local storage that cut QD1 write latency by 40% and raised flushed (database-commit) writes by 65%. With network storage such as Ceph, the network round trip dominates and the gain is small. - A supplemental I/O thread pool multiplies random-read IOPS. With
ioThreadsPolicy: supplementalPool, one disk’s queues spread over several I/O threads: 4K random reads went from 95k to 226k IOPS (2.4×) on local storage and from 27.5k to 49.7k IOPS (1.8×) on Ceph. Four threads was the sweet spot on an 8-vCPU VM; eight was worse. - Host page-cache modes hurt on fast storage.
cache: writethroughandcache: writebackcut random-read IOPS by about 30% and sequential writes by more than half on local LVM. On Ceph, writeback acknowledges small writes from host RAM (QD1 write latency 1.8 ms → 0.1 ms) but sequential writes collapse by 82%. - Guardrails matter. The High Performance preset avoids the slow combinations
(
io: threads, host caching), and the UI blocksio: nativewith a cache mode, which stops the VM from starting. blockMultiQueueandioThreadsPolicy: autochanged almost nothing in these tests, and the guest already gets one queue per vCPU withoutblockMultiQueue.
SUSE Virtualization (Harvester) 1.9.1 adds the KubeVirt high-performance disk settings to the VM editor (harvester#11550): a per-disk Performance Profile (Default, High Performance or Custom cache/I/O mode and dedicated I/O thread) and a VM-wide panel for block multi-queue and the I/O threads policy. I wrote that UI and the documentation, which ends with “benchmark before you use these in production”. So I did, and the results surprised me enough to write them up.
What I tested
One VM, 8 vCPUs and 8 GiB of RAM, Ubuntu 24.04, with a raw block data disk that I
benchmarked with fio from inside the guest. Between runs I changed only the data disk’s
settings, restarted the VM and dropped the host’s page cache. Two storage backends:
Local (lvm-thin) | Network (ceph-rbd) | |
|---|---|---|
| Path | LVM CSI thin volume, 1 MiB chunks | Ceph RBD over 10 GbE |
| Media | SATA SSD RAID behind a PERC H740P (write-back cache) | 6 SATA SSD OSDs on one older host, 2× replication |
| Data disk | 100 GiB, fully written first | 50 GiB, fully written first |
Compute ran on a single dual-socket Xeon Platinum 8160 host running SUSE Virtualization v1.9.0 (KubeVirt 1.8.4). I set the options in YAML, which is exactly what the 1.9.1 UI writes.
Compare rows, not tables
These two backends aren’t comparable: one is a local RAID set, the other a small single-host Ceph cluster reached over the network. Each table compares settings against that backend’s own Default row.
The fio jobs (direct I/O, libaio, 30 s each after a 5 s ramp, on the raw device):
| Job | What it represents |
|---|---|
| 4K random read/write, QD1, 1 job | per-I/O latency |
4K random write, QD1, fdatasync after every write | database commit / journal |
| 4K random read and write, QD32 × 8 jobs | busy OLTP-style VM |
| 4K random 70/30 read/write, QD16 × 8 jobs | mixed workload |
| 1 MiB sequential read and write, QD8 × 2 jobs | backup, streaming, bulk copy |
Each setting ran three times on each backend, rotating the order between rounds, and the
tables show the median. A fourth round of the key settings on local LVM (Default, High
Performance, supplementalPool and writeback) landed within a few percent of these
medians.
Results: local LVM
| Setting | QD1 read µs | QD1 write µs | Sync write IOPS | 4K read IOPS | 4K write IOPS | 70/30 IOPS | Seq read MiB/s | Seq write MiB/s |
|---|---|---|---|---|---|---|---|---|
| Default | 145 | 90 | 4,502 | 95,321 | 53,152 | 88,599 | 2,102 | 1,418 |
io: threads | 171 (+18%) | 150 (+66%) | 3,471 (-23%) | 71,681 (-25%) | 56,044 (+5%) | 69,115 (-22%) | 2,093 (-0%) | 1,118 (-21%) |
cache: writethrough | 183 (+26%) | 261 (+189%) | 3,289 (-27%) | 67,852 (-29%) | 35,405 (-33%) | 67,838 (-23%) | 1,427 (-32%) | 504 (-64%) |
cache: writeback | 189 (+30%) | 91 (+1%) | 3,200 (-29%) | 68,294 (-28%) | 59,977 (+13%) | 82,346 (-7%) | 1,419 (-33%) | 582 (-59%) |
| High Performance | 97 (-33%) | 54 (-40%) | 7,421 (+65%) | 93,495 (-2%) | 56,279 (+6%) | 94,540 (+7%) | 2,107 (+0%) | 1,111 (-22%) |
| HP + multi-queue | 95 (-35%) | 54 (-40%) | 7,282 (+62%) | 98,319 (+3%) | 56,777 (+7%) | 92,325 (+4%) | 2,090 (-1%) | 1,345 (-5%) |
HP + policy auto | 101 (-31%) | 54 (-41%) | 7,337 (+63%) | 100,443 (+5%) | 56,632 (+7%) | 91,782 (+4%) | 2,093 (-0%) | 1,244 (-12%) |
HP + supplementalPool ×4 | 97 (-33%) | 54 (-41%) | 7,321 (+63%) | 226,267 (+137%) | 57,075 (+7%) | 99,219 (+12%) | 2,094 (-0%) | 1,335 (-6%) |
bus: scsi | 138 (-5%) | 91 (+1%) | 4,533 (+1%) | 77,473 (-19%) | 55,804 (+5%) | 76,437 (-14%) | 2,093 (-0%) | 1,296 (-9%) |
Latency in µs (lower is better), everything else higher is better. HP = High Performance profile. Bold = an improvement of 5% or more over Default. Sequential writes on this RAID set varied by up to ±20% between runs, so treat differences below about 25% in the last column as noise.
Random 4K writes at high queue depth land between 53k and 60k IOPS in every row except
writethrough. That’s the RAID set’s ceiling, so no VM-side setting moves it much.
Results: Ceph RBD
| Setting | QD1 read µs | QD1 write µs | Sync write IOPS | 4K read IOPS | 4K write IOPS | 70/30 IOPS | Seq read MiB/s | Seq write MiB/s |
|---|---|---|---|---|---|---|---|---|
| Default | 1,148 | 1,831 | 479 | 27,539 | 8,575 | 13,161 | 841 | 132 |
io: threads | 1,120 (-2%) | 1,993 (+9%) | 476 (-0%) | 30,872 (+12%) | 7,038 (-18%) | 13,850 (+5%) | 839 (-0%) | 130 (-2%) |
cache: writethrough | 1,091 (-5%) | 1,957 (+7%) | 480 (+0%) | 34,025 (+24%) | 6,105 (-29%) | 10,405 (-21%) | 741 (-12%) | 118 (-10%) |
cache: writeback | 1,290 (+12%) | 90 (-95%) | 471 (-2%) | 27,800 (+1%) | 5,580 (-35%) | 17,154 (+30%) | 696 (-17%) | 23 (-82%) |
| High Performance | 1,104 (-4%) | 1,784 (-3%) | 485 (+1%) | 27,961 (+2%) | 7,908 (-8%) | 12,206 (-7%) | 850 (+1%) | 139 (+5%) |
| HP + multi-queue | 1,076 (-6%) | 1,773 (-3%) | 496 (+4%) | 29,329 (+6%) | 8,062 (-6%) | 12,340 (-6%) | 818 (-3%) | 126 (-5%) |
HP + policy auto | 988 (-14%) | 1,752 (-4%) | 517 (+8%) | 29,896 (+9%) | 8,017 (-7%) | 13,321 (+1%) | 865 (+3%) | 140 (+6%) |
HP + supplementalPool ×4 | 967 (-16%) | 1,728 (-6%) | 506 (+6%) | 49,668 (+80%) | 8,285 (-3%) | 15,075 (+15%) | 845 (+1%) | 136 (+3%) |
bus: scsi | 1,039 (-9%) | 1,823 (-0%) | 481 (+1%) | 22,733 (-17%) | 8,213 (-4%) | 13,474 (+2%) | 857 (+2%) | 136 (+3%) |
Finding 1: what High Performance changes compared with Default
Default and High Performance look alike on paper, so I dumped the libvirt domain of each VM to see what actually reaches QEMU. For a block-mode volume, Default already gets the uncached, native-AIO path from KubeVirt:
<driver name='qemu' type='raw' cache='none' error_policy='stop' io='native' discard='unmap'/>
High Performance writes cache: none and io: native explicitly and adds a
dedicated I/O thread, which shows up as one extra attribute:
<driver name='qemu' type='raw' cache='none' error_policy='stop' io='native' discard='unmap' iothread='2'/>
That thread is the whole difference, and it’s a meaningful one. Without it, the disk’s I/O is handled in QEMU’s main event loop alongside everything else the VM does. With it, the disk gets its own thread. On local LVM:
- QD1 write latency dropped from 90 µs to 54 µs (−40%).
- Flushed 4K writes (
fdatasyncafter every write, like a database commit) went from 4,500 to 7,400 IOPS (+65%). - QD1 read latency dropped by about a third.
Peak throughput stays where it was: one thread still tops out around 100k random-read IOPS, the same ceiling Default reaches. For throughput, see Finding 3.
With network storage such as Ceph, each I/O spends about 1–2 ms on the network and in the storage cluster, so a few microseconds saved on the host barely register. With the dedicated thread alone, the Ceph results moved by only a few percent either way.
Setting io: threads by hand, the obvious alternative, went the wrong way: local LVM
lost about 25% of its random-I/O throughput, with 66% higher QD1 write latency.
Finding 2: host page cache costs more than it gives on fast storage
writethrough and writeback route I/O through the host’s page cache. On a local RAID
set with its own write-back cache, that’s an extra copy with nothing to gain: random reads
drop about 30% and sequential writes fall by more than half.
With network storage such as Ceph, writeback shows both sides of host caching. A single 4K write returns in about
100 µs instead of 1.8 ms because the host’s RAM acknowledges it, and the mixed workload
improves by 30%. But sustained writes have to drain through the page cache and krbd
eventually, and sequential write fell from 132 MiB/s to 23 MiB/s. Writes that fsync
(the sync-write column) gain nothing, because every flush still goes to Ceph.
Writeback is a trade, not a free speed-up
With
cache: writeback, a write is acknowledged once it reaches host RAM. Guests that flush correctly (modern Linux and Windows file systems, databases) stay consistent, because flushes still reach the storage. But the speed-up only shows on unflushed writes, which are exactly the ones a host crash can lose. Measure your own workload before choosing it.
Finding 3: supplementalPool is the one that scales
A single I/O thread is a single CPU core polling the disk. The supplementalPool policy
gives the VM a pool of I/O threads, and KubeVirt maps one disk’s queues across all of
them. This is the data disk in the running domain with supplementalPoolThreadCount: 4:
<driver name='qemu' type='raw' cache='none' error_policy='stop' io='native' discard='unmap'>
  <iothreads>
    <iothread id='1'/>
    <iothread id='2'/>
    <iothread id='3'/>
    <iothread id='4'/>
  </iothreads>
</driver>
Compare that with the High Performance profile alone, where the disk gets exactly one
thread (iothread='2'). With the pool, random 4K reads at high queue depth went from about
95k to 226k IOPS on local LVM and from 27.5k to 49.7k IOPS on Ceph, with the latency
gains of High Performance kept.
spec:
  template:
    spec:
      domain:
        ioThreadsPolicy: supplementalPool
        ioThreads:
          supplementalPoolThreadCount: 4
        devices:
          disks:
            - name: datadisk
              disk: { bus: virtio }
              cache: none
              io: native
              dedicatedIOThread: true
In the UI, the per-disk High Performance profile alone gives the disk one dedicated thread (policy Shared). For the pool, also open the VM-wide High Performance (I/O Threads and Multi-Queue) panel, set I/O Threads Policy to Supplemental Pool and choose the I/O Thread Count.
How many threads?
More threads didn’t keep helping. I ran the pool with 2, 4 and 8 threads on the same 8-vCPU VM (one run each, so treat these as a direction rather than exact numbers):
| Pool threads | Local 4K read IOPS | Local 70/30 IOPS | Ceph 4K read IOPS | Ceph QD1 write |
|---|---|---|---|---|
| 1 (High Performance only) | 93k | 95k | 28.0k | 1.78 ms |
| 2 | 170k | 119k | 33.6k | 1.86 ms |
| 4 | 226k | 99k | 49.7k | 1.73 ms |
| 8 | 160k | 76k | 32.4k | 3.23 ms |
Four threads was the best overall on both backends. Eight threads, as many as the VM has vCPUs, gave back most of the gain, cut the mixed workload below Default on local storage and nearly doubled QD1 write latency on Ceph. Two threads won the mixed workload on local storage, so for a write-heavy disk 2 is worth trying too.
Without the per-disk dedicated-thread flag, the pool still works: on local LVM the result was the same, but on Ceph it reached +55% instead of +80%. Keep both on.
Each thread in the pool can use a host core when the disk is busy, so count them like vCPUs when you size the node.
Finding 4: multi-queue and auto change little
blockMultiQueue: true didn’t show up as a consistent gain, and the guest shows why: even without it, /sys/block/vdb/mq already lists 8 queues on this
8-vCPU VM, because QEMU sizes virtio-blk queues to the vCPU count by default. Setting it only makes the queue count explicit in the domain (queues='8').
ioThreadsPolicy: auto creates a few more threads (3 instead of 2 here) and spreads
disks across them, but each disk still gets one thread. With a single busy disk, it
behaves like High Performance. It helps VMs with many busy disks, which this test didn’t
have.
Finding 5: virtio-blk still beats virtio-scsi on random I/O
bus: scsi lost 14–19% on random reads and the mixed workload on local storage, the same
direction as my earlier
Windows virtio-blk vs virtio-scsi comparison.
Use virtio-scsi when you need what SCSI adds (many disks per controller, persistent
reservations), not for speed.
What I’d recommend
- Use High Performance for any disk where latency matters (databases, logs, message queues). Its dedicated I/O thread is where the latency gain comes from, and it’s largest on local storage.
- Default is a sound baseline for everything else. On block volumes it already uses the uncached native path, so general-purpose VMs aren’t leaving much on the table.
- Add
supplementalPoolfor disks that need IOPS. Start with 4 threads, or about half the VM’s vCPUs; going up to the full vCPU count made things worse. Budget the host cores for it. - Avoid
writethrough. Considerwritebackonly for workloads with many small, unflushed writes, after measuring. - Don’t expect VM settings to raise the storage’s ceiling. If every row in a column is the same, the backend is the limit.
Thanks
This feature had a lot of hands on it. Thanks to Vicente Cheng for triaging the issue and merging the UI, Jack Yu and Andy Lee for reviewing it, Volker Theile for the UX feedback, and Marcelo Fukumoto for reviewing the follow-up fix. Justin Huang tested it thoroughly and found the issues that fix addressed. On the documentation, thanks to Ivan Sim, Alexandra Settle and Po Han Huang, and to Khushboo for reviewing the regression tests.